Airline Weather
Industry Solutions
Explore real-world use cases and solutions tailored to each industry's unique weather challenges.

Construction Weather

Logistics Weather

Facility & Plant Weather

Municipal Weather

Retail Weather

Energy Weather

Dam Weather

Insurance Weather

Agricultural Weather

School Weather

Event Weather

Sports Weather

Road Weather

Railway Weather

Climate Tech

Broadcasting Weather

Coastal Weather

Airline Weather

General Aviation Weather

Drone Weather
Weather Solutions
Industry Solutions
Top PageWeather Solutions
Analysis of Aviation Meteorological Elements at São Paulo/Guarulhos International Airport (SBGR/GRU)
March 31, 2026 Weathernews

São Paulo/Guarulhos International Airport (SBGR/GRU) is located in the São Paulo metropolitan area, the largest urban region in Brazil, and serves as one of South America’s leading international aviation hubs. It handles one of the highest annual passenger volumes in the region, with a wide range of routes including long-haul international flights connecting North America, Europe, and Asia, as well as extensive domestic services supporting Brazil’s vast national air network.
This analysis is based on five years of observational data (METAR) from 2019 to 2023. It examines the trends, characteristics, and occurrence mechanisms of key aviation meteorological elements at GRU. The aim is to support more accurate operational decision-making and improve preparedness for weather-related risks.
São Paulo/Guarulhos International Airport is located near the forested area of the Cantareira mountain range, situated in a low-lying wetland area between the Baquirivu-Guaçu River and the Tietê River. Due to these geographical conditions, radiation fog tends to form easily—especially during the cooler season from April to September—under the influence of the South Atlantic Subtropical High. The surrounding mountains also contribute to the formation of updrafts during daytime heating. As a result, air mass thunderstorms are more likely to develop in summer, while rainfall associated with the passage of cold fronts can occur in winter.
Precipitation
・Precipitation is relatively infrequent year-round. Even in February, the peak month, occurrences remain limited. It is slightly more common in summer. ・No snowfall has been recorded.
Thunderstorms
・Thunderstorms occur throughout the year and increase from summer to autumn. The highest frequency is from January to March. ・They are most often observed between 18Z and 24Z. While they can occur at most hours (except around 11Z), they tend to concentrate in the local late afternoon to evening, indicating both frontal thunderstorms and convection triggered by afternoon heating.
Wind Direction
・The prevailing wind throughout the year is from the northeast to east, particularly east-northeast (60–80°), followed by southeast (120–130°). The ENE component becomes more pronounced in winter (June–August). ・Crosswinds are generally uncommon throughout the year.
Wind Speed
・Wind speeds of 4–6 kt occur most frequently in all months. Strong winds above 13 kt are relatively rare, though slightly more common in winter. Average speeds tend to be higher from May to October. ・Gusts are very infrequent throughout the year, even during the peak months of May, July, and August.
Visibility
・Visibility of 3200 m or less is mainly observed in winter, though it can occur in most months. Very low visibility below 800 m is relatively rare and tends to concentrate from May to July (late autumn to winter). ・Low visibility (≤3200 m) occurs most frequently between 08Z–12Z, with visibility below 800 m especially concentrated in this period. ・Since it often occurs from pre-dawn to early morning in winter, moist low-level air and nighttime radiational cooling are likely key factors.
Ceiling
・Low ceilings below 1200 ft are not uncommon, occurring frequently in June and from August to November. Extremely low ceilings below 200 ft tend to concentrate from May to July.
Explore real-world use cases and solutions tailored to each industry's unique weather challenges.
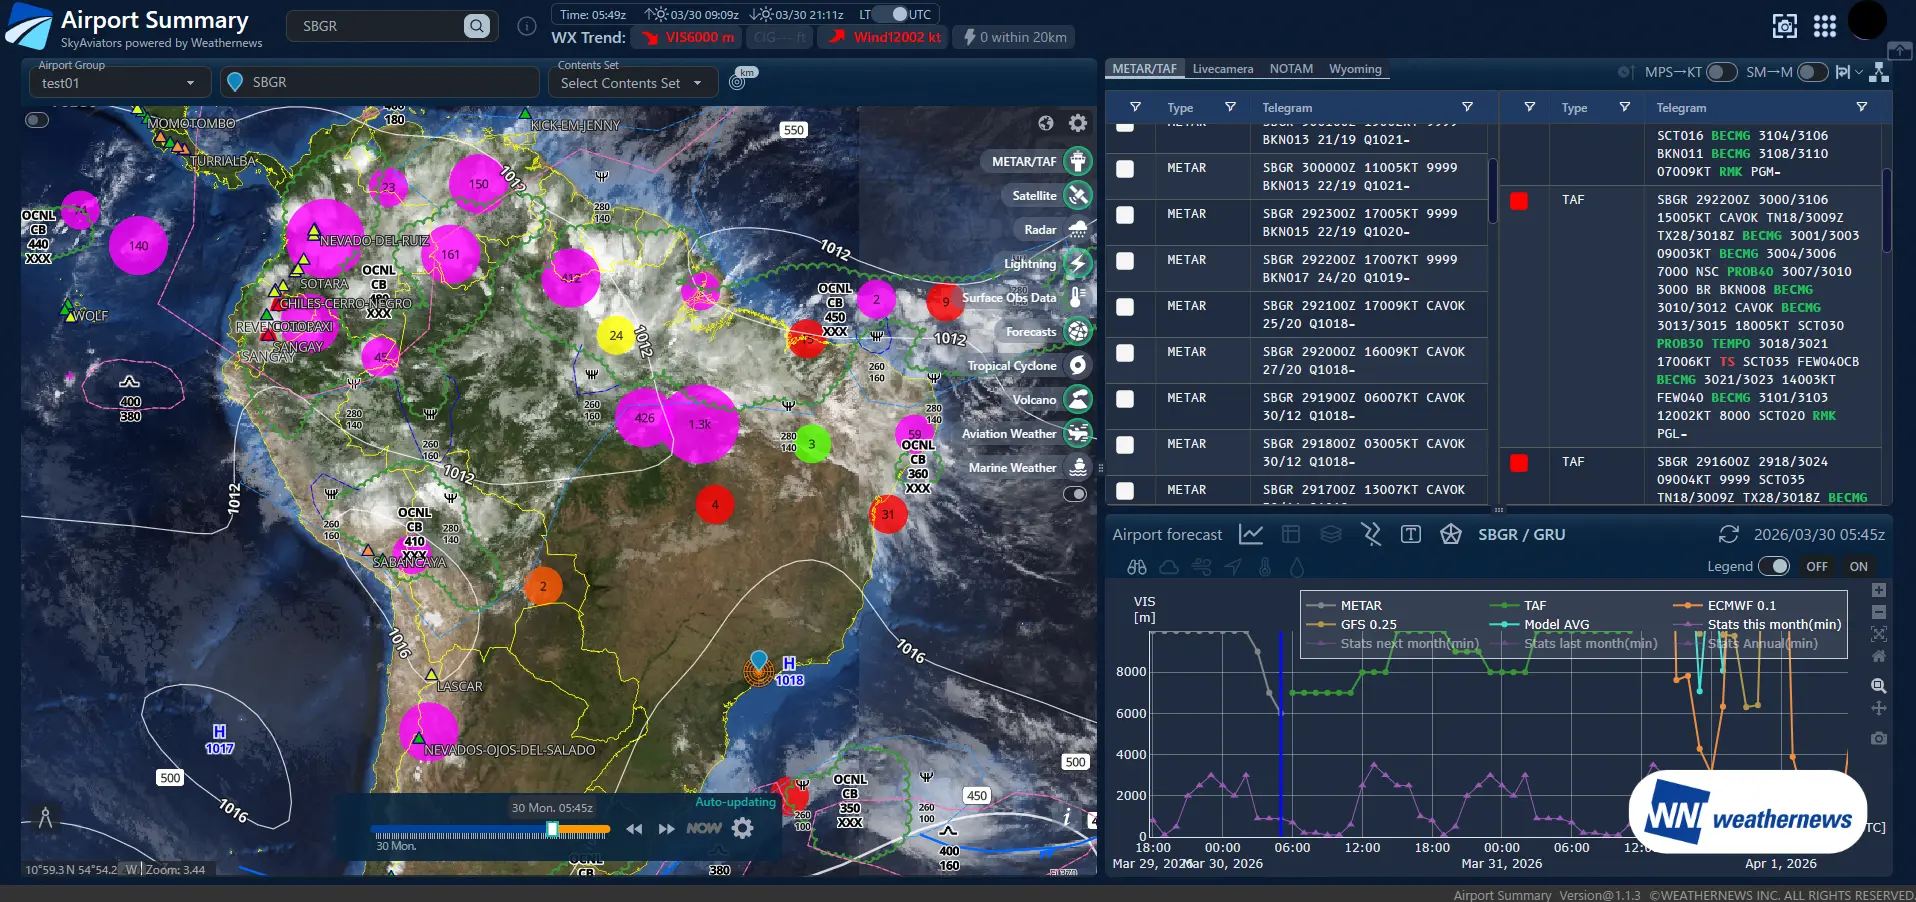
SkyAviators is a comprehensive weather intelligence platform developed by Weathernews for airlines. Powered by world-class meteorological data and decades of aviation weather expertise, it empowers operational decision-making when it matters most. The Airport Summary & Model Comparison feature integrates multiple numerical weather prediction models and ICAO-standard forecast reliability assessments into a single view. This enables users to quickly identify forecast discrepancies and uncertainty, supporting weather interpretation and decision-making aligned with airline operational policies.
Multiple numerical weather prediction models—including regional models, global models, and proprietary forecasts—are consolidated into a single view together with historical observation data.
Forecast reliability for each numerical model is visualized using evaluation methods based on ICAO standards.
Three numerical weather prediction models for the same region are displayed in parallel, enabling direct comparison under identical conditions.
Historical observations, current conditions, and future forecasts are seamlessly integrated into a time-series display.
Objective reliability assessments clarify which model should be used as the decision reference. This improves both the speed and confidence of Go / No-Go decisions, helping prevent delays in operational judgment.
Model reliability is standardized using ICAO-based evaluation methods, reducing reliance on individual expertise or personal judgment. This allows the entire team to apply consistent decision criteria.
When weather variability is high and decisions become challenging, multiple forecast models are compared and their confidence evaluated to provide reliable support for operational decision-making.
There is no need to switch between multiple websites or screens. By consolidating all relevant information into a single view, analysis time is reduced, allowing teams to focus on making decisions.
Please feel free to consult with us about implementation methods, features, or advancing specific considerations. We'll answer even the smallest questions.
We'll explain pricing details and provide specific content based on your site conditions so you can consider with confidence.
Free Quote
We'll explain in detail how to utilize features and the implementation process. Please feel free to consult with us.
Consider Implementation