Airline Weather
Industry Solutions
Explore real-world use cases and solutions tailored to each industry's unique weather challenges.

Construction Weather

Logistics Weather

Facility & Plant Weather

Municipal Weather

Retail Weather

Energy Weather

Dam Weather

Insurance Weather

Agricultural Weather

School Weather

Event Weather

Sports Weather

Road Weather

Railway Weather

Climate Tech

Broadcasting Weather

Coastal Weather

Airline Weather

General Aviation Weather

Drone Weather
Weather Solutions
Industry Solutions
Top PageWeather Solutions
Phuket International Airport (VTSP/HKT): Seasonal Thunderstorm Risk and Operational Measures
February 10, 2026 Weathernews

Phuket International Airport (VTSP/HKT) in the Kingdom of Thailand lies within a tropical monsoon climate zone and experiences hot and humid conditions throughout the year. The primary weather phenomenon affecting flight operations is thunderstorms, and understanding their seasonal occurrence patterns is essential for developing stable and reliable operational plans.
Phuket International Airport (VTSP) is an international airport located in the northern part of Phuket Island, a resort destination in southern Thailand. The airport lies within a tropical monsoon climate zone, with high temperatures throughout the year and daytime highs generally exceeding 30°C. September to October corresponds to the rainy season, while November to February is considered the dry season; however, convective precipitation typical of tropical climates can occur year-round. The primary weather phenomenon that disrupts flight operations is thunderstorms. These occur most frequently between 09Z and 18Z throughout the year, with a pronounced peak in activity between 11Z and 16Z.
・Spring (March–May):April and May are the hottest months of the year. Thunderstorms accompanied by short-duration heavy rainfall peak from March to April. Thunderstorm activity is frequent between 08Z and 19Z, with the highest occurrence rates from 10Z to 15Z. In March, days with reduced visibility are relatively common, mainly associated with rainfall, with average visibility around 3,000 meters.
・Summer (June–August):This period corresponds to the rainy season, though rainfall is generally short-lived and does not persist for long durations. Thunderstorms may occur at any time of day, but their overall frequency is lower than in other seasons. Days with degraded visibility are relatively frequent, primarily due to precipitation.
・Autumn (September–November):September and October are characterized by high humidity and sultry conditions. In October, thunderstorms frequently occur between 11Z and 17Z, with a peak from 13Z to 16Z. In November, thunderstorms are most common between 09Z and 18Z, with the highest occurrence between 11Z and 14Z. Through October, the number of days with reduced visibility due to rainfall remains high.
・Winter (December–February):Thunderstorms are most likely to occur between 12Z and 16Z in December, 11Z and 17Z in January, and 12Z and 16Z in February. Visibility reductions are mainly associated with rainfall, and conditions below 1,000 meters are typically short-lived.
At tropical airports, operational decisions depend not only on whether thunderstorms will occur, but also on when their impacts are likely to begin and how long they may persist.
Even when thunderstorm potential is indicated, uncertainty in the exact onset timing and duration can complicate operational planning, making it difficult to determine the realistic impact window.
A clearer understanding of both the likelihood of thunderstorms and their expected impact period would support ground operations, departure sequencing, and resource allocation, helping airlines reduce unnecessary delays.
Explore real-world use cases and solutions tailored to each industry's unique weather challenges.
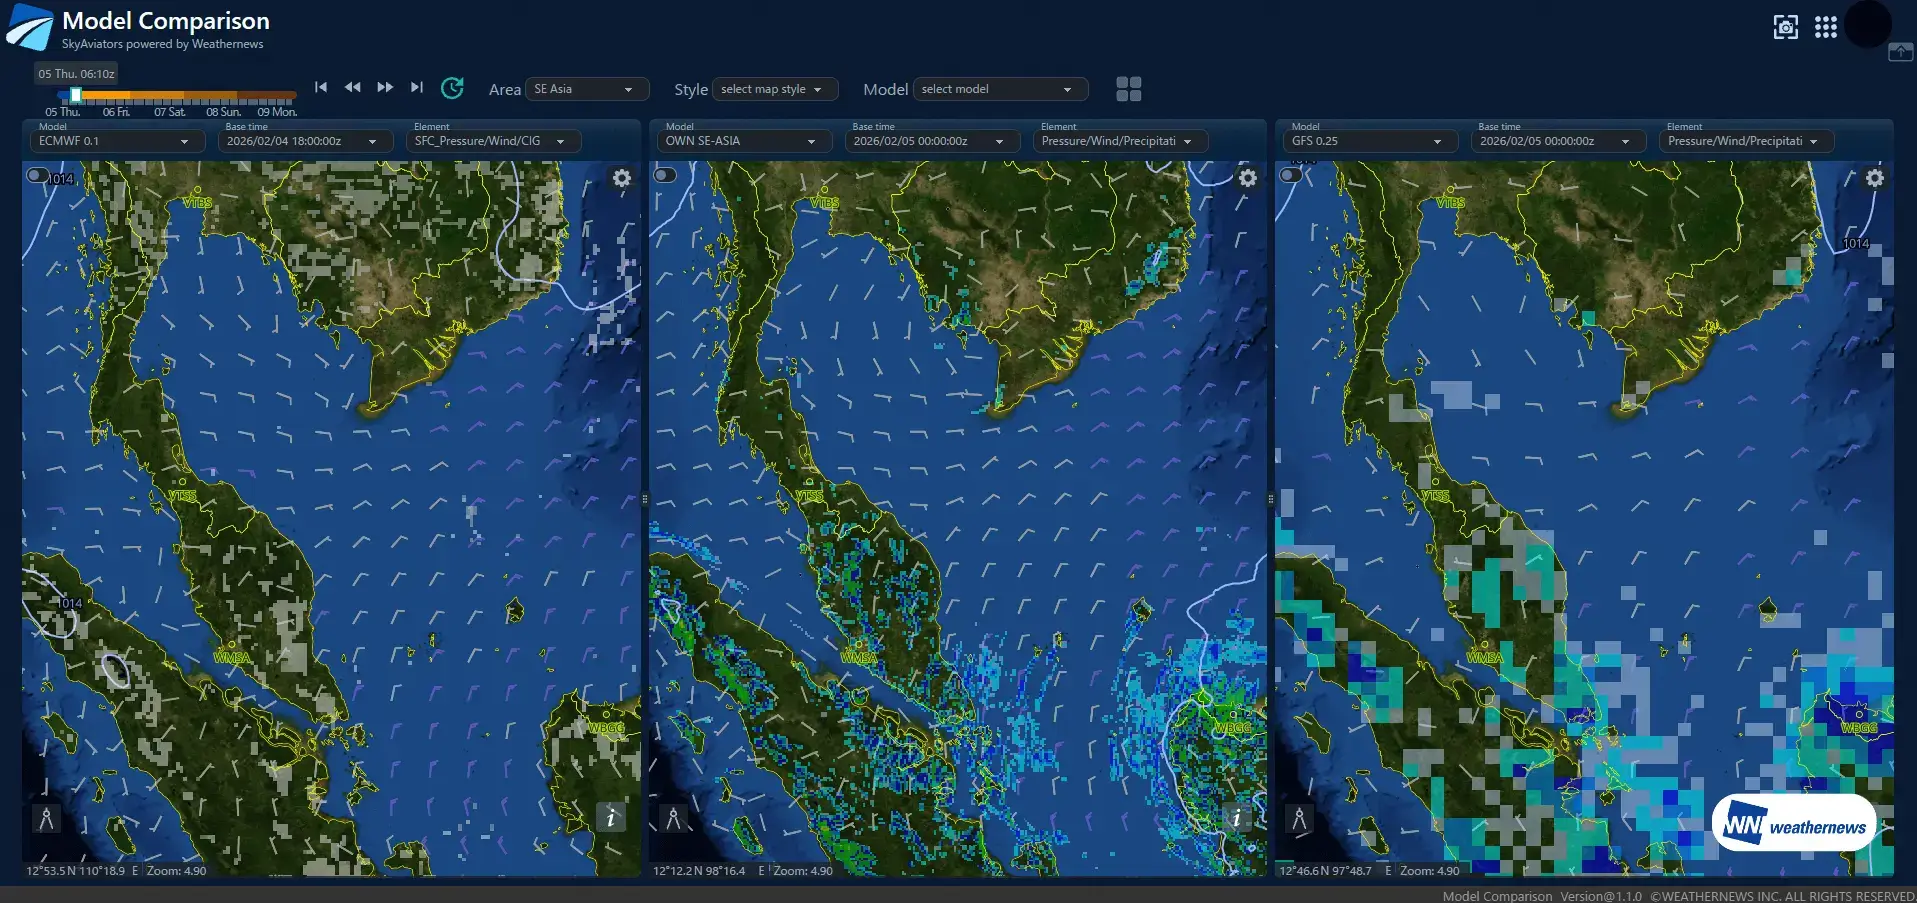
SkyAviators is a comprehensive weather intelligence platform developed by Weathernews for airlines. Powered by world-class meteorological data and decades of aviation weather expertise, it empowers operational decision-making when it matters most. The Airport Summary & Model Comparison feature integrates multiple numerical weather prediction models and ICAO-standard forecast reliability assessments into a single view. This enables users to quickly identify forecast discrepancies and uncertainty, supporting weather interpretation and decision-making aligned with airline operational policies.
Multiple numerical weather prediction models—including regional models, global models, and proprietary forecasts—are consolidated into a single view together with historical observation data.
Forecast reliability for each numerical model is visualized using evaluation methods based on ICAO standards.
Three numerical weather prediction models for the same region are displayed in parallel, enabling direct comparison under identical conditions.
Historical observations, current conditions, and future forecasts are seamlessly integrated into a time-series display.
Objective reliability assessments clarify which model should be used as the decision reference. This improves both the speed and confidence of Go / No-Go decisions, helping prevent delays in operational judgment.
Model reliability is standardized using ICAO-based evaluation methods, reducing reliance on individual expertise or personal judgment. This allows the entire team to apply consistent decision criteria.
When weather variability is high and decisions become challenging, multiple forecast models are compared and their confidence evaluated to provide reliable support for operational decision-making.
There is no need to switch between multiple websites or screens. By consolidating all relevant information into a single view, analysis time is reduced, allowing teams to focus on making decisions.
Please feel free to consult with us about implementation methods, features, or advancing specific considerations. We'll answer even the smallest questions.
We'll explain pricing details and provide specific content based on your site conditions so you can consider with confidence.
Free Quote
We'll explain in detail how to utilize features and the implementation process. Please feel free to consult with us.
Consider Implementation