Airline Weather
Industry Solutions
Explore real-world use cases and solutions tailored to each industry's unique weather challenges.

Construction Weather

Logistics Weather

Facility & Plant Weather

Municipal Weather

Retail Weather

Energy Weather

Dam Weather

Insurance Weather

Agricultural Weather

School Weather

Event Weather

Sports Weather

Road Weather

Railway Weather

Climate Tech

Broadcasting Weather

Coastal Weather

Airline Weather

General Aviation Weather

Drone Weather
Weather Solutions
Industry Solutions
Top PageWeather Solutions
Winter storms continue to impact the US, as record-breaking bitter cold affects flights
January 29, 2026 Weathernews

Winter Storm Fern impacted the eastern US, triggering widespread aviation disruption, with more than 10,000 flights canceled by January 25.
However, the impacts are far from over.
The National Weather Service (NWS) forecasts an unusually prolonged cold spell, with sub-freezing air expected to persist through around February 1.For the aviation industry, this is not merely a short-lived winter storm, but a sustained operational risk lasting nearly two weeks.
From January 31 through February 1, a deep trough accompanied by cold air of −36°C or lower at the 500 hPa level is expected to move southeastward from the central to eastern US, while a surface low pressure system tracks northeastward along the US Atlantic coast. As a result, heavy snowfall is possible across the eastern US. As snowfall intensifies, strong winds may develop, raising concerns for deteriorating road conditions due to snow accumulation and icing, as well as significant visibility reductions. In Myrtle Beach, precipitation is expected to begin as rain and transition to snow; however, freezing rain (FZRA) or ice pellets (PL) remain possible depending on surface temperature trends. In Boston and Raleigh, precipitation is forecast to fall as snow from the onset. Please note that the timing, snowfall amounts, and precipitation type remain sensitive to the evolution of the upper-level trough, surface low, and thermal structure.
Airport
Logan International Airport
Raleigh–Durham International Airport
Myrtle Beach International Airport
City
Boston
Raleigh
Myrtle Beach
ICAO/IATA
KBOS / BOS
KRDU / RDU
KMYR / MYR
Snow Timing
from 0300 UTC 1 Feb to 1500 UTC 2 Feb
from 0300 UTC 31 Jan to 1200 UTC 1 Feb
from 1800 UTC 31 Jan to 1500 UTC 1 Feb
Peak Snowfall Period
from 1500 UTC 1 Feb to 2100 UTC 1 Feb
from 1800 UTC 31 Jan to 0600 UTC 1 Feb
from 0000 UTC 1 Feb to 0900 UTC 1 Feb
Low VIS / CIG due to Snow
from 1500 UTC 1 Feb to 2100 UTC 1 Feb
from 1800 UTC 31 Jan to 0600 UTC 1 Feb
from 0000 UTC 1 Feb to 0900 UTC 1 Feb
Forecast Snowfall Amount (through 0000 UTC Feb 3rd)
15–20 cm
40–60 cm
30–50 cm
Freezing Precipitation (PL / FZRA)
NIL
NIL
NIL
Strong Winds ≥ 20 kt
from 1500 UTC 1 Feb to 0100 UTC 2 Feb
NIL
NIL
Minimum Temperature during Snowfall
−9℃ (1100–1600 UTC 1 Feb)
−10℃(2200 UTC 31 Jan – 0200 UTC 1 Feb)
−8℃(1100–1300 UTC 1 Feb)
The defining characteristic of this cold wave is the repeated cycle of temporary easing followed by renewed deterioration.
While conditions showed brief improvement on January 26–27, another surge of Arctic air is expected to arrive on January 31. For airlines, this has made it extremely difficult to determine when normal operations can safely resume. In prolonged cold events like this, it is critical to look beyond ‘today’s weather’ and understand how risks will evolve through the coming week.
Key questions include: ・When and where will additional Arctic air impact operations? ·Which airports are likely to see increased de-icing activity? ・How will operational risk evolve across the entire network?
Explore real-world use cases and solutions tailored to each industry's unique weather challenges.
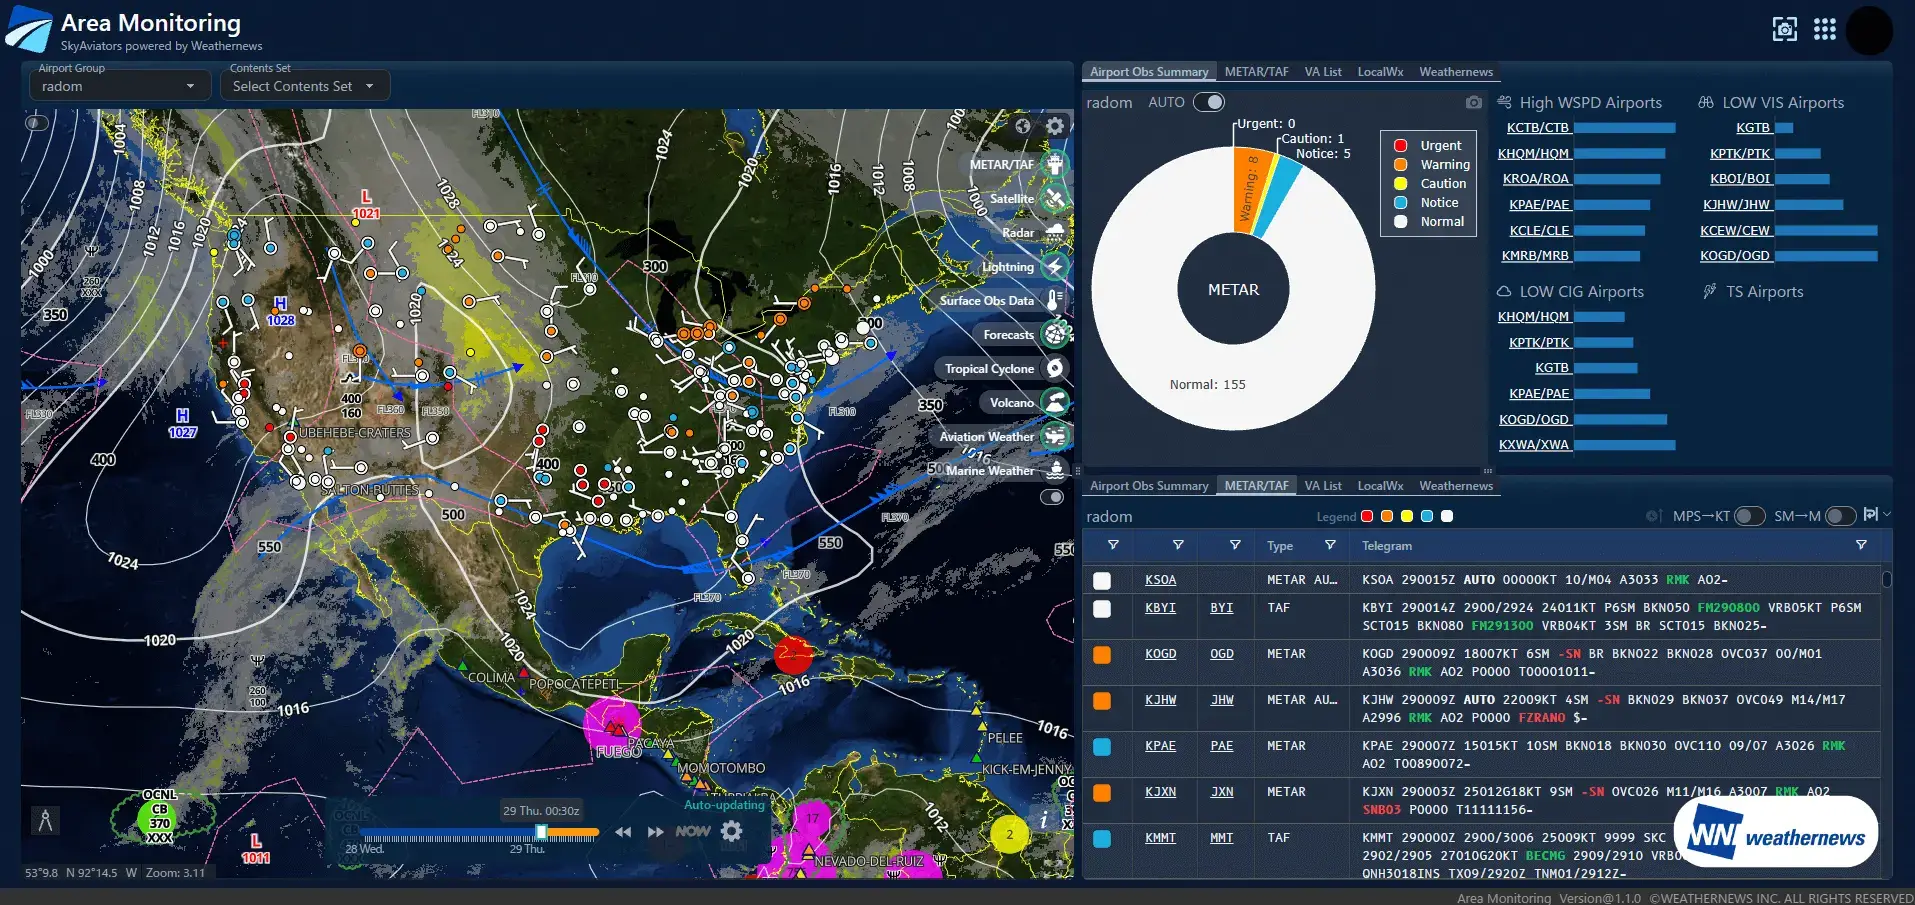
SkyAviators is a comprehensive weather intelligence platform developed by Weathernews for airlines. Powered by world-class meteorological data and decades of aviation weather expertise, it empowers operational decision-making when it matters most. The Area Monitoring feature continuously tracks the development, movement, and expansion of snowfall and other hazardous weather across wide areas. By identifying affected airports and air routes at an early stage, it enables strategic action before operational impacts occur.
Weather conditions across the entire monitoring area are displayed on a single screen. Radar, satellite imagery, snowfall, lightning, turbulence, and other relevant data layers can be freely overlaid—allowing users to intuitively grasp both localized phenomena and large-scale patterns.
The system displays monitored airports with color coding based on predefined operational impact thresholds. Risk levels are instantly recognizable, making it easy to identify airports requiring immediate attention.
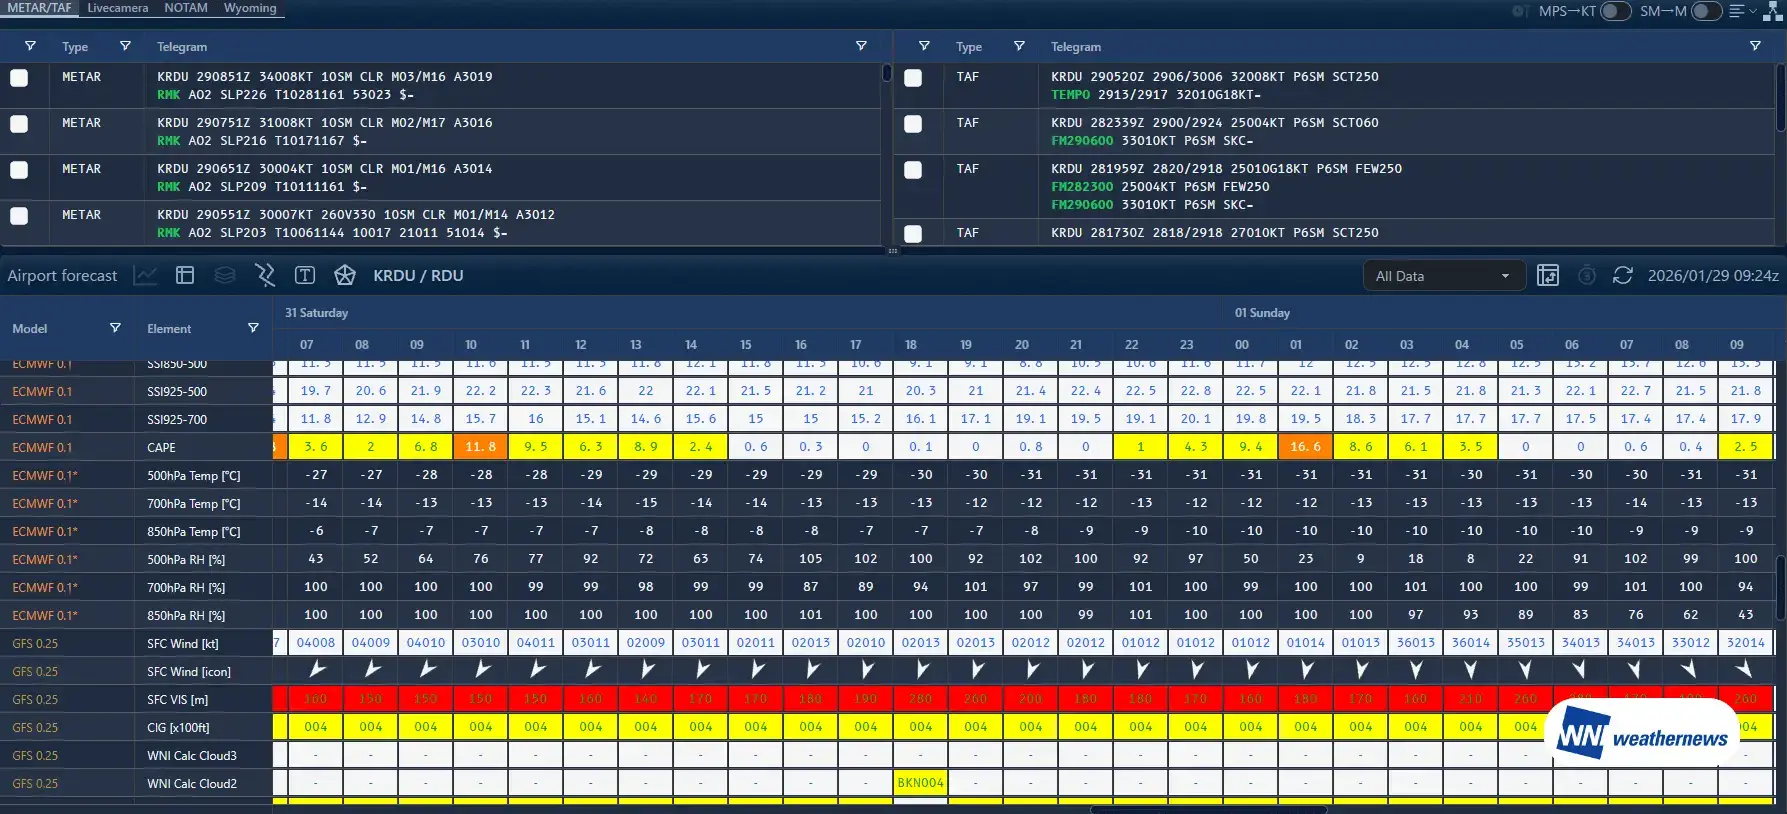
Real-time weather conditions and future forecasts for each airport are shown on the same screen. Both current and forecast risks are color-coded, enabling continuous visibility into present and upcoming operational threats.
Monitoring areas and target airports can be freely customized to match the operational network. Hubs, priority routes, or specific regions can be monitored according to operational strategy.
Simultaneous visualization of wide-area weather and airport risk enables early detection of events that may affect operations.
Color-coded displays clarify which airports and regions require the highest priority response, helping teams stay aligned across OCC and dispatch teams.
By combining real-time conditions with forecasts, the system supports advance decisions on aircraft and crew allocation, schedule adjustments, and contingency planning.
Reducing unexpected cancellations and delays helps improve operational stability and maintain customer satisfaction.
Please feel free to consult with us about implementation methods, features, or advancing specific considerations. We'll answer even the smallest questions.
We'll explain pricing details and provide specific content based on your site conditions so you can consider with confidence.
Free Quote
We'll explain in detail how to utilize features and the implementation process. Please feel free to consult with us.
Consider Implementation